

Unleash the power of trading with the top 5 indicators for crypto trading. Explore the potential of moving averages, RSI, Bollinger Bands, MACD, and Fibonacci retracement to boost your trading decisions.
Introduction
Trading cryptocurrencies is increasing in popularity, bringing in seasoned investors and newbies. The crypto market is volatile; therefore, you’ll need a plan to survive. Well-informed trading decisions often involve the use of indicators. Indicators can be crucial in cryptocurrency trading, and this article examines the top five that could make a significant difference.

Understanding Crypto Trading Indicators
What are indicators?
Supercharge your cryptocurrency trading by utilizing indicators, which enable you to make educated predictions based on past data. These invaluable tools assist in evaluating market conditions and forecasting potential price fluctuations.
Why are indicators important in crypto trading?
When trading cryptocurrencies, indicators are essential because they help traders make rational judgments based on market facts rather than gut feelings. They aid investors in pinpointing market patterns, turning points, and entry/exit opportunities.

Types of indicators
There are various types of indicators used in crypto trading:
Trend indicators
Decipher the long-term trend with the assistance of indicators like the Average Directional Index (ADX), Bollinger Bands, and moving averages.
Oscillators
When oscillators reach extreme values, the market is either overbought or oversold. They aid investors in spotting possible trend reversals. Popular indicators include the RSI and the stochastic oscillator.
Read More: The Comprehensive Guide to Crypto Wallets: 6 Types Every Investor Must Know
Volume indicators
Assess the trading activity of a cryptocurrency with volume indicators, offering insights into the strength or weakness of a trend. The On-Balance-Volume (OBV) and the Chaikin Money Flow (CMF) are notable indicators.
Volatility indicators
Track the speed of price changes and assess the risk associated with specific coins using volatility indicators. Popular volatility measures include the Average True Range (ATR) and Bollinger Bands.
Sentiment indicators
Evaluate the market sentiment and the sentiment of individual participants with sentiment indicators. These valuable tools provide insights into the market’s psychology and potential shifts in sentiment. Commonly used sentiment indicators include social media sentiment analysis and surveys.

Top 5 Indicators For Crypto Trading
Moving Averages
Introduction to moving averages
Moving averages are often used as markers in crypto trading to help spot trends and smooth out price data over a certain period. They help people make better decisions by clearly showing the market’s direction.
Simple Moving Average
Simple Moving Average (SMA) is a way to determine the average price at the end of a particular time. Traders frequently employ the simple moving average (SMA) for its simplicity and effectiveness. SMAs aid in identifying potential support and resistance levels, as well as determining the overall trend.

Exponential Moving Average (EMA)
The Exponential Moving Average shows weight to recent price information, which makes it more sensitive to changes in the market. It provides a moving average that is faster and more active than the SMA. Traders often use EMAs to find short-term trends and possible places to buy or sell.
Benefits and limitations of moving averages
Using moving averages in crypto trading can help you get many benefits. These flexible indicators are significant for finding trends, lowering price volatility, and setting clear support and resistance levels. It’s important to know that their cues may be late in choppy or flat markets. Consider combining moving averages with other indicators to make the best trading choices and get better analysis.
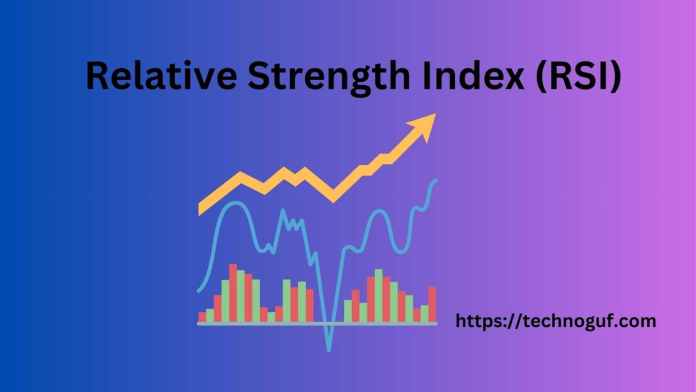
Relative Strength Index (RSI)
Understanding RSI
The Relative Strength Index (RSI) is a famous oscillator trader used to measure how fast and how much prices change. It moves between 0 and 100 and shows where a cryptocurrency’s price is substantial and where it is weak.
Interpreting RSI values
When the RSI values exceed 70, it indicates an overbought condition, hinting at a potential price reversal or correction. Conversely, RSI values below 30 suggest an oversold situation, indicating a probable price bounce or recovery. Traders leverage these levels to identify potential entry or exit points.
Identifying overbought and oversold conditions
The RSI helps traders identify overbought and oversold conditions, indicating potential market reversals. An RSI reading above 70 indicates the cryptocurrency’s potential overvaluation, signaling a price correction likelihood. Conversely, an RSI below 30 suggests a possible undervaluation of the cryptocurrency, indicating a potential price rebound.
Strategies for using RSI effectively
Traders use RSI in various ways to improve their trading decisions. Some common strategies include:
- RSI Divergence: Traders look for divergences between the price movement and the RSI to identify potential trend reversals.
- Overbought/Oversold: Traders use the “overbought” and “oversold” levels to decide when to get into or out of a deal.
- RSI Trendline Breakout: Traders draw trendlines on the RSI indicator and look for breakouts, which can signal potential trend shifts.
- RSI Moving Average Crossover: Traders combine RSI with moving averages and look for crossovers as confirmation of potential entry or exit points.
Even though RSI is a valuable tool, it is best to use it with other indicators and analysis methods to make better trading choices.
Bollinger Bands
Introduction to Bollinger Bands
Bollinger Bands are an essential technical indicator in cryptocurrency trading. A price chart displays them as three lines: middle band, upper band, and bottom bar. The middle band usually represents a simple moving average, while standard deviations show how far away each upper and lower band are from it.
Interpreting Bollinger Bands
Bollinger Bands provide valuable information about volatility and price levels. When a cryptocurrency’s price reaches the upper band, it indicates it has reached the upper limit. It may signal that there has been an excessive amount of buying activity, which could lead to a reversal or correction in the price. Conversely, the cryptocurrency is oversold when the price is near the lower band, and a potential price bounce or recovery may happen.

Identifying volatility and price reversals
Bollinger Bands can help traders identify periods of high or low volatility. When the bands expand, it indicates increased market volatility, while contraction suggests decreased volatility. Volatility contractions are often followed by periods of significant price movements, allowing traders to anticipate potential breakouts or trend reversals.
Combining Bollinger Bands with other indicators
Traders often combine Bollinger Bands with other indicators to strengthen their trading analysis. For example, they may use Bollinger Bands with the Relative Strength Index (RSI) to confirm overbought or oversold conditions. Additionally, traders may look for price breakouts outside the Bollinger Bands and use other trend indicators to validate the flight.
Remember that Bollinger Bands should not be relied upon as standalone indicators. Combining them with other technical analysis tools is crucial to enhance the accuracy of trading signals.
MACD (Moving Average Convergence Divergence)
MACD Overview of
One of the most well-known momentum indicators used in cryptocurrency trading is the Moving Average Convergence Divergence (MACD). The MACD line, signal line, and histogram illustrating the difference between the two are displayed. Leverage the MACD to identify trends and gives buy and sell signals accordingly.
Understanding MACD histogram and the signal line
The MACD histogram shows the difference between the MACD and signal lines. When the histogram is positive, it indicates bullish momentum, while a negative histogram suggests bearish momentum. The signal line, representing a moving average of the MACD line, generates trading signals.

Identifying bullish and bearish signals
Traders look for various signals generated by the MACD to make trading decisions. Some standard signs include:
Signal Line Crossovers: When the MACD line crosses above the signal line, it generates a bullish sign. Conversely, when the MACD line crosses below the signal line, it generates a bearish signal.
Centerline Crossovers: When the MACD line crosses above the zero centerlines, it indicates bullish momentum. On the other hand, a sign of negative rate is when the MACD line goes below the centerline.
Divergence and convergence patterns
Patterns of divergence and closure in the MACD tell us much about when a trend might change. When the price forms lower lows and the MACD forms higher lows, this is a positive divergence and may signal an impending upward trend reversal. Alternatively, a bearish divergence occurs when the price rises while the MACD falls. A downward shift is possible if divergence and convergence patterns emerge.
Fibonacci Retracement
Explaining Fibonacci retracement levels
Fibonacci retracement is a tool used in technical analysis to find possible support and resistance levels in a coin’s price movement. The Fibonacci regression is based on the Fibonacci sequence. It uses a set of numbers where each number is the sum of the two numbers before it. Fibonacci retracement levels, which are given as percentages, show possible price points where the price might change direction or stop moving before continuing in the direction of the trend.

Identifying support and resistance levels
Traders use Fibonacci retracement levels to identify critical support and resistance levels. The standard Fibonacci retracement levels include 23.6%, 38.2%, 50%, 61.8%, and 78.6%. These levels are drawn from significant price swings and are potential areas where the price may find support (during an uptrend) or resistance (during a downtrend).
Using Fibonacci extensions for profit targets
Traders use Fibonacci extensions in addition to retracement levels to identify potential profit targets. These extensions project upward or downward from a significant price swing and act as areas where the price may reach after a trend continuation. Common Fibonacci extension levels include 127.2%, 161.8%, and 261.8%.
Traders combine Fibonacci retracement and extension levels with other technical analysis tools to confirm potential support and resistance areas and profit targets to make more informed trading decisions.
Conclusion
In conclusion, you must understand and use indicators to trade crypto successfully. This piece discussed essential things like moving averages, RSI, Bollinger Bands, MACD, and Fibonacci retracement.
Moving averages help find trends and levels of support and resistance. RSI shows when a stock has been bought or sold too much. Bollinger Bands show price changes and changes in price. MACD gives signs for following trends. Fibonacci retracement finds support and resistance levels.
To be successful in trading, you must combine indicators and backtest methods, exercise risk management, and control your emotions. It is essential to continue learning and evolving.
Keep up with market trends, change your strategies, and use risk management to protect your cash. By using indicators well, you can make better trading choices and increase your chances of success in cryptocurrency trading.
Frequently Asked Questions (FAQs)
Which indicator is best for beginners?
The Simple Moving Average (SMA) is often considered a good indicator for beginners. It represents the average price over a specific period, helping traders identify trends and potential entry/exit points.
How often should I check indicators when trading?
The frequency of checking indicators depends on your trading strategy and timeframe. Traders with shorter timeframes may need to check indicators more frequently, such as hourly or daily. Longer-term traders may review indicators on a daily or weekly basis.
Can I rely solely on indicators for successful trading?
While indicators provide valuable insights, it is advisable not to rely solely on them. To make good trading choices, traders need to combine indicators with other types of analysis, such as fundamental analysis and market sentiment.
Are these indicators applicable to all types of cryptocurrencies?
A wide range of cryptocurrencies supports the application of indicators. Nevertheless, it is crucial to consider each cryptocurrency’s unique characteristics and volatility before employing these indicators. Specific cryptocurrencies may necessitate adjustments or supplementary analysis.